Recently, Associate Professor Yanping Mao's team from the College of Chemistry and Environmental Engineering at Shenzhen University published the latest research progresses 《Metagenomic approach revealed the mobility and co-occurrence of antibiotic resistomes between non-intensive aquaculture environment and human》 on journal《Microbiome》.(2023 IF: 15.5; 5 year IF: 19.4)

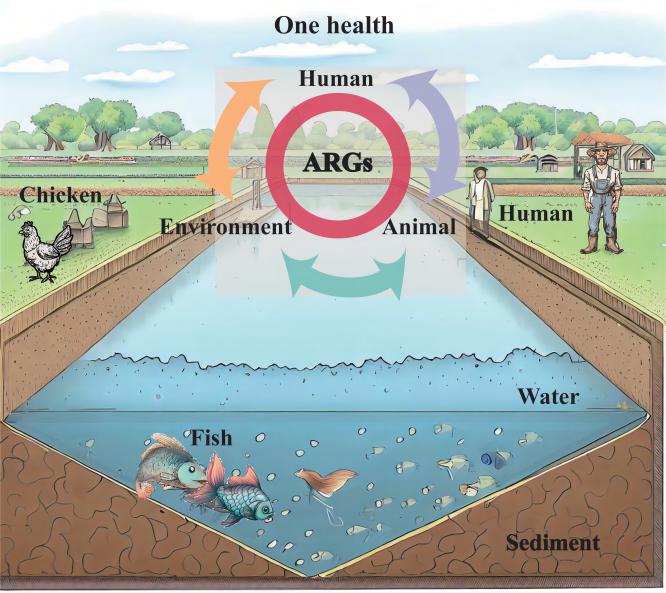
Graphical Abstract
Aquaculture is an important food source worldwide. The use of antibiotics in intensive large-scale farm have resulted in the development of resistance. Non-intensive aquaculture is another aquatic feeding model that is conducive to ecological and environmental protection. However, the transmission of resistomes in non-intensive aquaculture hasn't been well characterized. Moreover, it is unclear about the influence of aquaculture resistomes on human health. Here metagenomic approach was employed to identify the transfer patterns of aquaculture resistomes and estimate the potential risks to human health. The results demonstrated that antibiotic resistance genes (ARGs) were widely present in non-intensive aquaculture systems and the core ARGs of aquaculture environment exhibited mobility. ARGs of non-intensive aquaculture environment were mainly shaped by microbial communities and mobile genetic elements. Additionally, the prevalence of shared ARGs in different samples suggested the mobility of aquaculture resistomes, and sulfonamides resistance gene sul1 was detected simultaneously in aquaculture environment and human. The same species of human pathogens carried ARGs were identified in both aquaculture system and human gut indicated the potential risks of resistomes transfer. The mobility and pathogenicity of aquaculture resistomes were explored by metagenomic approach. Given the observed co-occurrence of resistomes between the aquaculture environment and human, we recommend enhanced regulation of resistomes in non-intensive aquaculture environment.

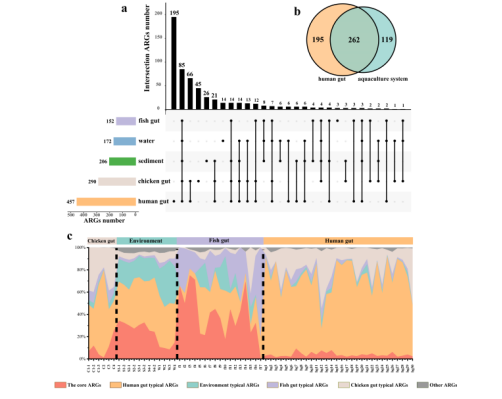
The core ARGs in aquaculture system. a: UpSet diagram shows the number of ARGs shared and unique between different sample groups. Solid black points indicate ARGs occurrence in this sample group, and points linked by lines indicate ARGs shared by different sample groups. The bar chart on the top shows the number of ARGs unique or shared by sample groups, and the bar chart on the left shows the total number of detected ARG subtypes. b: The Venn diagram shows the number of ARGs shared by the human gut and aquaculture system. c: The percent stacked histogram shows the composition of typical and core ARGs (indicated by different colors). Human gut and environment typical ARGs defined as ARGs detected in all human gut and environment samples (fishpond sediment and water samples) respectively.

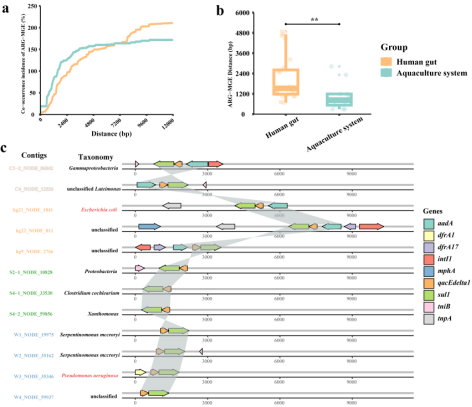
The co-occurrence pattern of ARGs and mobile genetic elements (MGEs) based on contigs. a: The co-occurrence incidence of ARG and MGE. The x-axis means the distance of ARG-MGE, and the y-axis means the co-occurrence incidence. With the increase of distance, the co-occurrence rate also increases and gradually reaches a peak. b: The shortest distance of ARG-MGE in the human gut and aquaculture system (** p < 0.01 indicates significant difference). c: Gene arrangement patterns of sul1-qacEdelta1 and neighborhood genes in different sample groups. Different colored contigs belong to different sample groups, and the taxonomy names colored in red indicate pathogenic bacteria.
Full-text link:https://doi.org/10.1186/s40168-024-01824-x
